
Introducing Report Filters, Interactive Charts, and Saved Views
July 8, 2026 · 3 min read
As firms grow, so do the questions they ask of their data. We’re excited to introduce three new reporting capabilities that make it easier to explore and interact with report data in Wealthbox.
With Report Filters, Interactive Charts, and Saved Views, you can quickly focus on the information that matters most, investigate trends, and save commonly used report views for future use.
Together, these enhancements make reports more flexible, allowing you to quickly narrow data, investigate trends, and return to your most commonly used views with a single click.
Filter Reports Without Creating New Ones
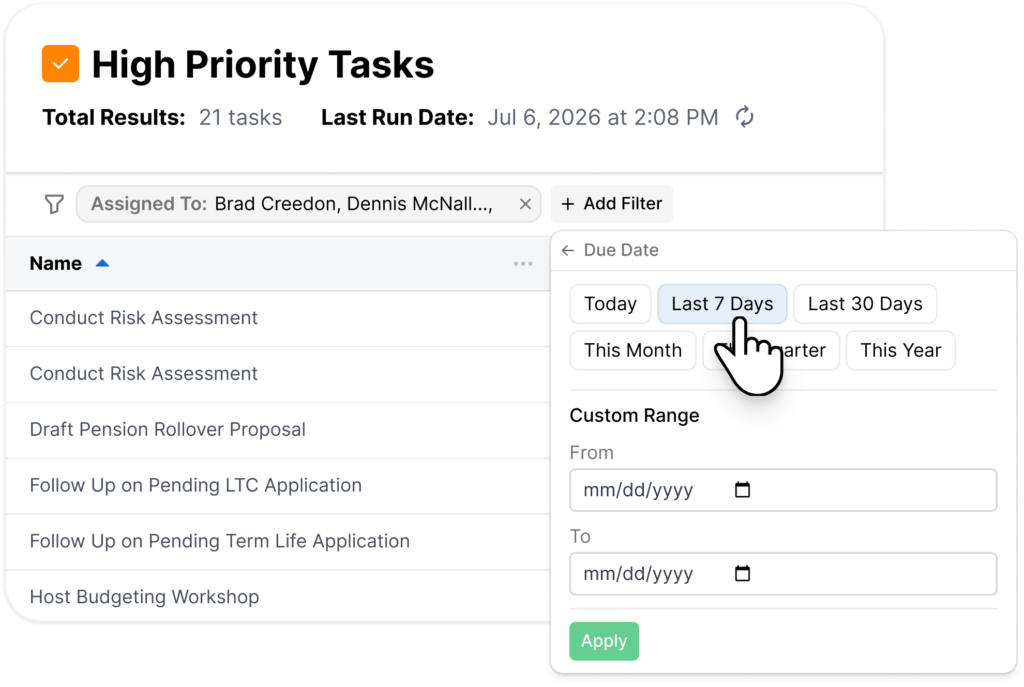
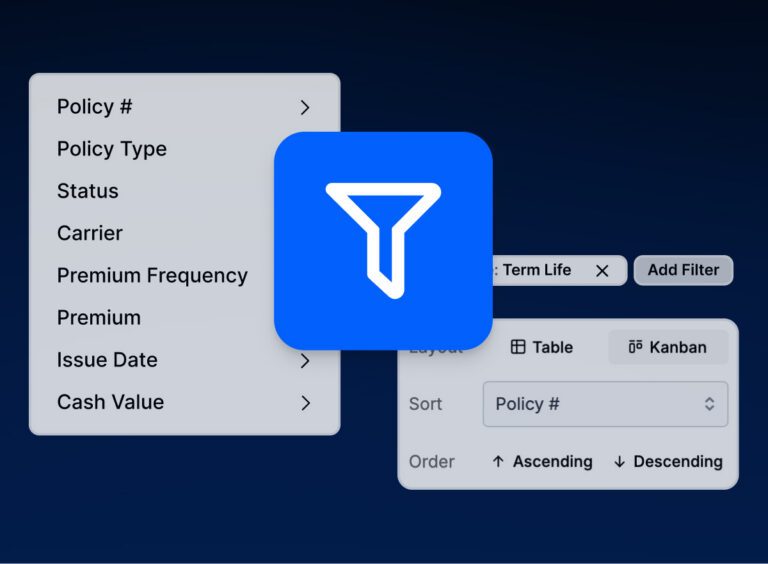
Report Filters allow you to apply filters directly within any report.
Instead of building separate reports for different advisors, date ranges, opportunity stages, or custom field values, you can filter an existing report and immediately see updated results. As filters are applied, the report table, calculations, charts, and exports automatically update to reflect only the matching records.
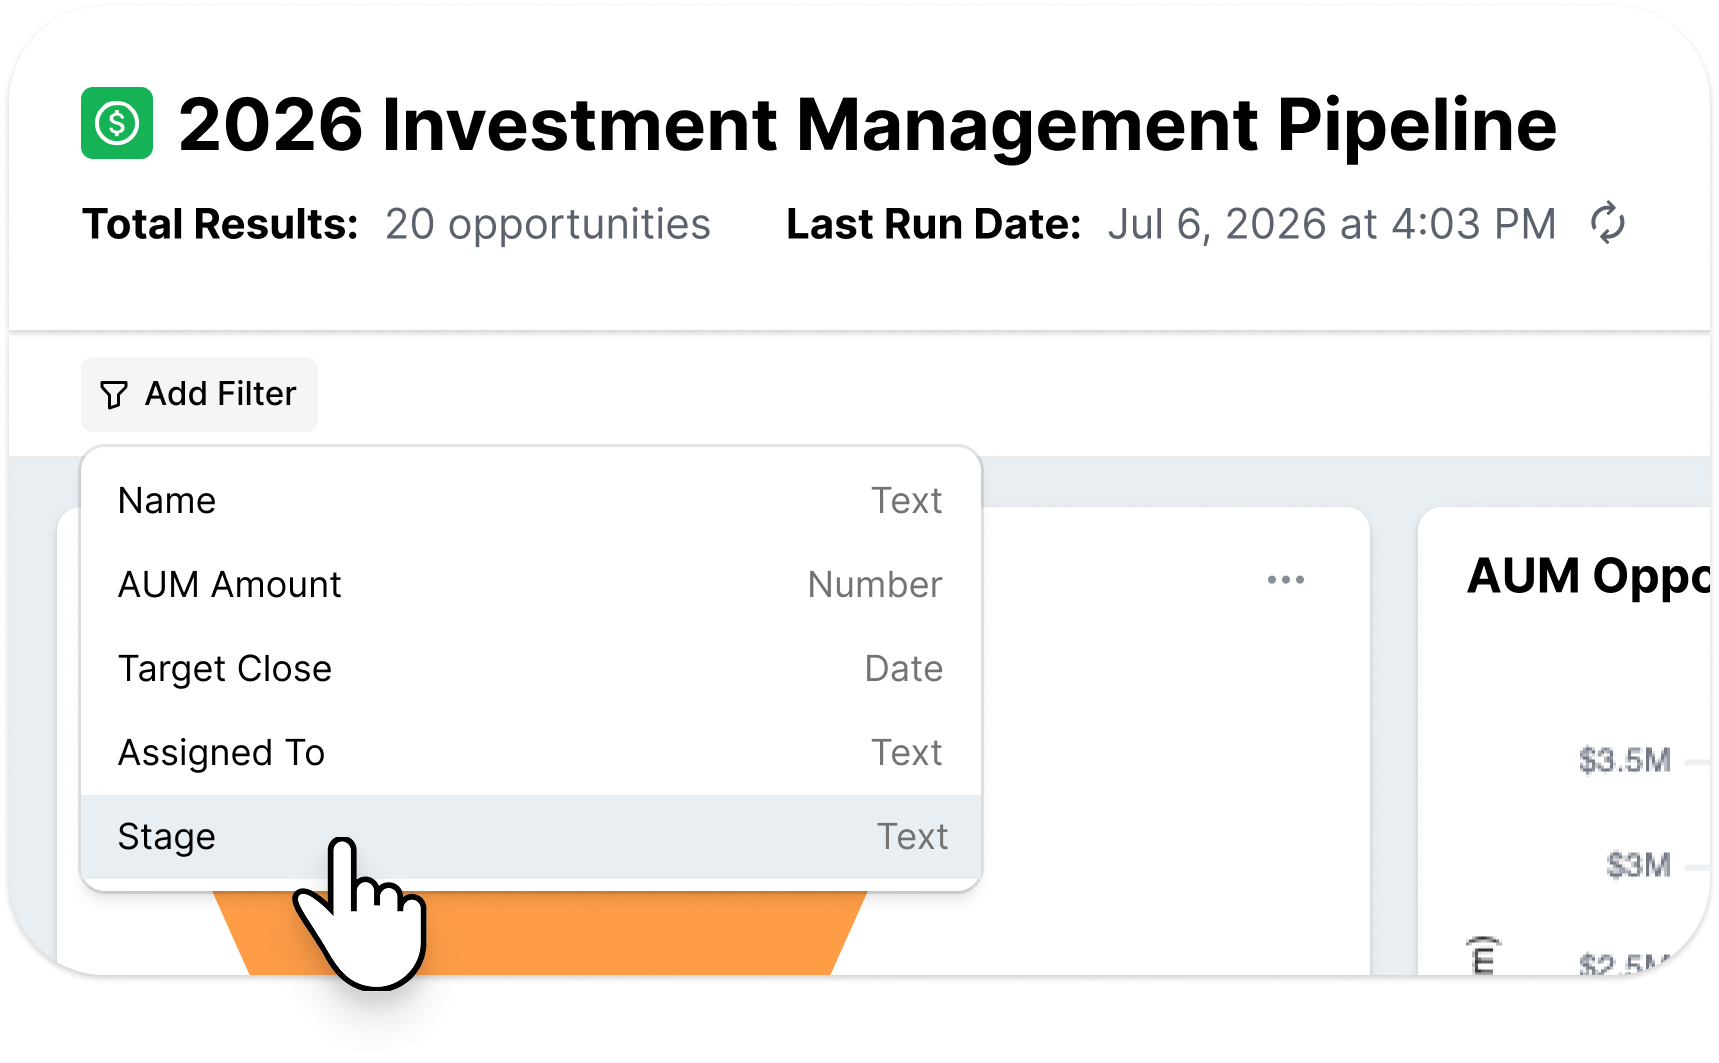
Filters can be added from the report toolbar or directly from individual columns, making it easy to refine your results as you work.
Explore the Data Behind Your Charts
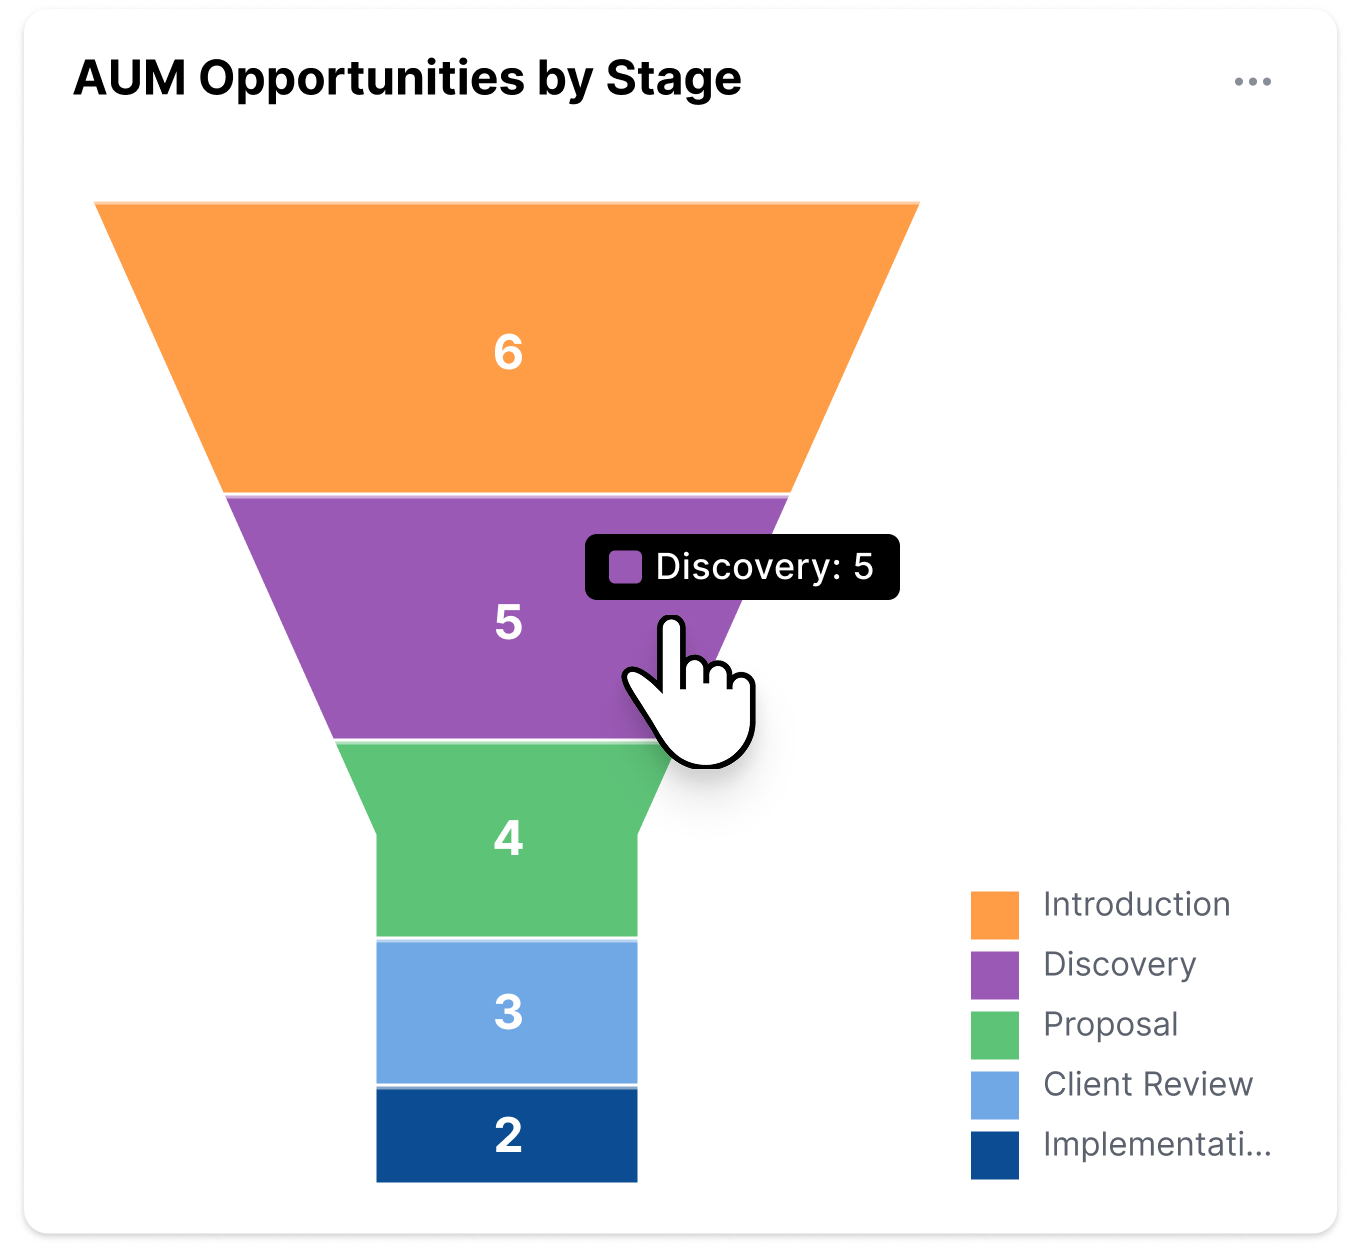
Interactive Charts now provide another way to work with your report data.
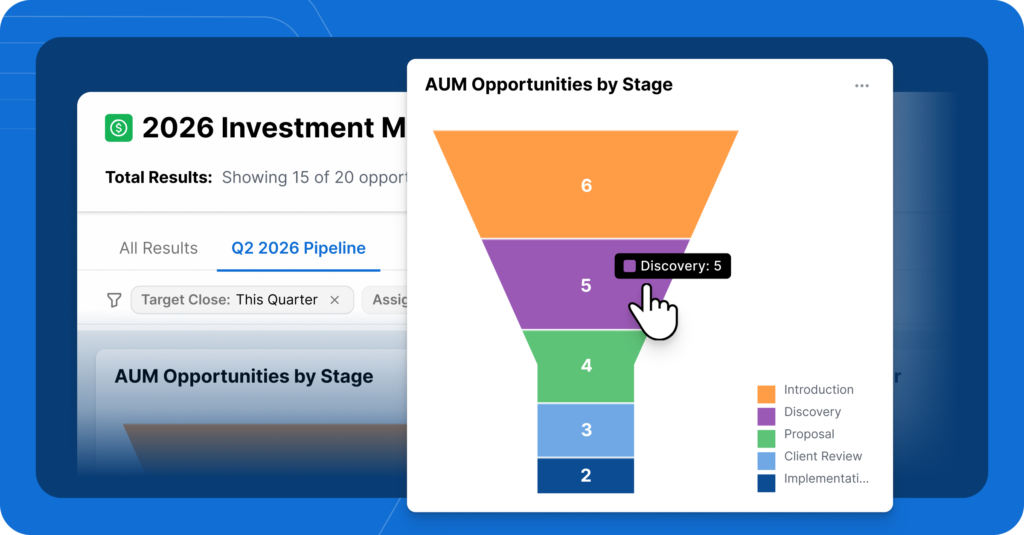
Clicking a segment of a chart automatically filters the report to show the records behind that portion of the chart. The applied filter behaves just like any other report filter, allowing you to modify or remove it at any time.
Dashboard charts can also now be interactive. Selecting a chart segment opens the associated report in a new tab with the appropriate filter already applied, making it easy to move from a dashboard summary to the underlying data.
Save Frequently Used Report Views
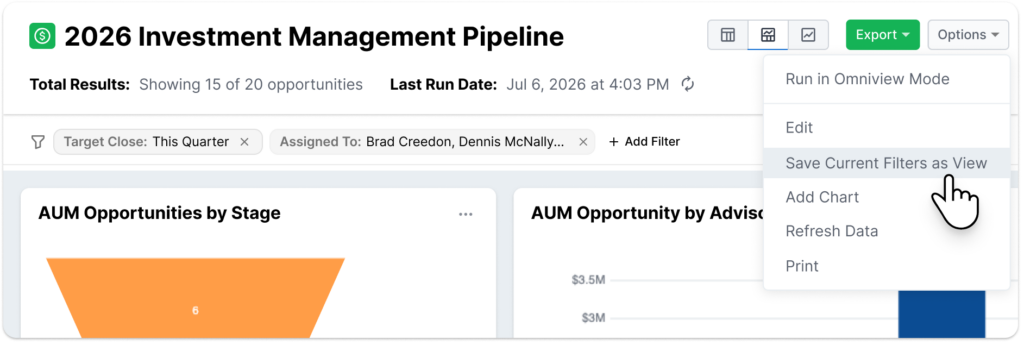
Many firms rely on the same filtered reports every day.
Saved Views let you save a combination of report filters as a named view that can be accessed again at any time. Once saved, each view appears as a tab within the report, making it easy to switch without rebuilding filters.
Saved Views are shared with everyone who has access to the report, helping teams work from the same reporting views across the organization.
More Flexible Reporting
These enhancements make it easier to explore report data without creating additional reports or exporting information for further analysis.
Whether you’re reviewing pipeline activity, client assignments, workflow performance, or custom data, Report Filters, Interactive Charts, and Saved Views provide a more flexible way to analyze information directly within Wealthbox.
Availability
Report Filters, Interactive Charts, and Saved Views are available for Wealthbox Premier and Enterprise accounts. We’re excited to bring a more interactive reporting experience to Wealthbox and look forward to seeing how firms use these new capabilities to answer questions faster, uncover insights, and make more informed decisions.